新しいコントロール/エクステンダ
本バージョンでは新たにチャートコントロールが追加され、シート+チャートというベーシックな業務アプリケーションをSPREADのみで実現できるようになりました。また、数式エクステンダにより、SPREADが備える豊富な種類の数式による計算をアプリケーション全体に適用できます。
チャートコントロール
これまでSPREADシート内でしか利用できなかったチャートを、チャートコントロールという独立したコントロールとして使用することが可能です。シートに設定されたデータを可視化する際のチャートとして、またチャートのみをWebフォーム上に配置することもできます。
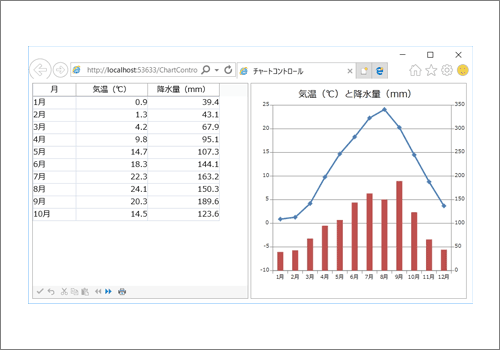
ここでは、年間の気温と降水量を示すデータをグラフ化したチャートコントロールを配置する例を紹介します。
    Protected Sub Page_Load(ByVal sender As Object, ByVal e As System.EventArgs) Handles Me.Load
        If IsPostBack Then Return

        FpSpread1.ActiveSheetView.RowHeader.Visible = False
        FpSpread1.ActiveSheetView.Columns(1).Width = 150
        FpSpread1.ActiveSheetView.Columns(2).Width = 150

        '------------------------------------------------------
        ' データソースの設定とシートへの連結
        '------------------------------------------------------
        Dim table As New System.Data.DataTable()
        table.Columns.Add("月", Type.GetType("System.String"))
        table.Columns.Add("気温(℃)", Type.GetType("System.Double"))
        table.Columns.Add("降水量(mm)", Type.GetType("System.Double"))
        table.Rows.Add(New Object() {"1月", 0.9, 39.4})
        table.Rows.Add(New Object() {"2月", 1.3, 43.1})
        table.Rows.Add(New Object() {"3月", 4.2, 67.9})
        table.Rows.Add(New Object() {"4月", 9.8, 95.1})
        table.Rows.Add(New Object() {"5月", 14.7, 107.3})
        table.Rows.Add(New Object() {"6月", 18.3, 144.1})
        table.Rows.Add(New Object() {"7月", 22.3, 163.2})
        table.Rows.Add(New Object() {"8月", 24.1, 150.3})
        table.Rows.Add(New Object() {"9月", 20.3, 189.6})
        table.Rows.Add(New Object() {"10月", 14.5, 123.6})
        table.Rows.Add(New Object() {"11月", 8.8, 66.1})
        table.Rows.Add(New Object() {"12月", 3.7, 44.2})
        FpSpread1.DataSource = table

        '------------------------------------------------------
        ' チャートコントロールの設定
        '------------------------------------------------------

        ' シリーズの設定
        Dim series1 As New FarPoint.Web.Chart.LineSeries()
        series1.Values.DataSource = table
        series1.Values.DataField = "気温(℃)"
        series1.CategoryNames.DataSource = table
        series1.CategoryNames.DataField = "月"
        series1.YAxisId = 0
        Dim series2 As New FarPoint.Web.Chart.BarSeries()
        series2.Values.DataSource = table
        series2.Values.DataField = "降水量(mm)"
        series2.CategoryNames.DataSource = table
        series2.CategoryNames.DataField = "月"
        series2.YAxisId = 1

        ' 軸の設定
        Dim y1 As New FarPoint.Web.Chart.ValueAxis()
        y1.AxisId = 0
        y1.Location = FarPoint.Web.Chart.AxisLocation.Near
        y1.AutoMinimum = False
        y1.Minimum = -10
        y1.LabelTextFont = New Drawing.Font("メイリオ", 8)
        Dim y2 As New FarPoint.Web.Chart.ValueAxis()
        y2.AxisId = 1
        y2.Location = FarPoint.Web.Chart.AxisLocation.Far
        y2.AutoMaximum = False
        y2.Maximum = 350
        y2.MajorGridVisible = False
        y2.LabelTextFont = New Drawing.Font("メイリオ", 8)

        ' プロットエリアの設定
        Dim plotArea As New FarPoint.Web.Chart.YPlotArea()
        plotArea.Location = New System.Drawing.PointF(0.1F, 0.1F)
        plotArea.Size = New System.Drawing.SizeF(0.83F, 0.77F)
        plotArea.Series.Add(series1)
        plotArea.Series.Add(series2)
        plotArea.XAxis.LabelTextFont = New Drawing.Font("メイリオ", 8)
        plotArea.YAxes.Clear()
        plotArea.YAxes.AddRange(New FarPoint.Web.Chart.ValueAxis() {y1, y2})

        ' ラベルの設定
        Dim label As New FarPoint.Web.Chart.LabelArea()
        label.Text = "気温(℃)と降水量(mm)"
        label.Location = New System.Drawing.PointF(0.5F, 0.02F)
        label.AlignmentX = 0.5F
        label.AlignmentY = 0.0F
        label.TextFont = New Drawing.Font("メイリオ", 14)

        ' モデルへの追加
        Dim model As New FarPoint.Web.Chart.ChartModel()
        model.LabelAreas.Add(label)
        model.PlotAreas.Add(plotArea)
        FpChart1.Model = model
    End Sub
protected void Page_Load(object sender, EventArgs e)
{
    if (IsPostBack) return;

    FpSpread1.ActiveSheetView.RowHeader.Visible = false;
    FpSpread1.ActiveSheetView.Columns[1].Width = 150;
    FpSpread1.ActiveSheetView.Columns[2].Width = 150;

    //------------------------------------------------------
    // データソースの設定とシートへの連結
    //------------------------------------------------------
    System.Data.DataTable table = new System.Data.DataTable();
    table.Columns.Add("月", Type.GetType("System.String"));
    table.Columns.Add("気温(℃)", Type.GetType("System.Double"));
    table.Columns.Add("降水量(mm)", Type.GetType("System.Double"));
    table.Rows.Add(new object[] {"1月",0.9,39.4});
    table.Rows.Add(new object[] {"2月",1.3,43.1});
    table.Rows.Add(new object[] {"3月",4.2,67.9});
    table.Rows.Add(new object[] {"4月",9.8,95.1});
    table.Rows.Add(new object[] {"5月",14.7,107.3});
    table.Rows.Add(new object[] {"6月",18.3,144.1});
    table.Rows.Add(new object[] {"7月",22.3,163.2});
    table.Rows.Add(new object[] {"8月",24.1,150.3});
    table.Rows.Add(new object[] {"9月",20.3,189.6});
    table.Rows.Add(new object[] {"10月",14.5,123.6});
    table.Rows.Add(new object[] {"11月",8.8,66.1});
    table.Rows.Add(new object[] {"12月",3.7,44.2});
    FpSpread1.DataSource = table;

    //------------------------------------------------------
    // チャートコントロールの設定
    //------------------------------------------------------

    // シリーズの設定
    FarPoint.Web.Chart.LineSeries series1 = new FarPoint.Web.Chart.LineSeries();
    series1.Values.DataSource = table;
    series1.Values.DataField = "気温(℃)";
    series1.CategoryNames.DataSource = table;
    series1.CategoryNames.DataField = "月";
    series1.YAxisId = 0;
    FarPoint.Web.Chart.BarSeries series2 = new FarPoint.Web.Chart.BarSeries();
    series2.Values.DataSource = table;
    series2.Values.DataField = "降水量(mm)";
    series2.CategoryNames.DataSource = table;
    series2.CategoryNames.DataField = "月";
    series2.YAxisId = 1;

    // 軸の設定
    FarPoint.Web.Chart.ValueAxis y1 = new FarPoint.Web.Chart.ValueAxis();
    y1.AxisId = 0;
    y1.Location = FarPoint.Web.Chart.AxisLocation.Near;
    y1.AutoMinimum = false;
    y1.Minimum = -10;
    y1.LabelTextFont = new System.Drawing.Font("メイリオ", 8);
    FarPoint.Web.Chart.ValueAxis y2 = new FarPoint.Web.Chart.ValueAxis();
    y2.AxisId = 1;
    y2.Location = FarPoint.Web.Chart.AxisLocation.Far;
    y2.AutoMaximum = false;
    y2.Maximum = 350;
    y2.MajorGridVisible = false;
    y2.LabelTextFont = new System.Drawing.Font("メイリオ", 8);

    // プロットエリアの設定
    FarPoint.Web.Chart.YPlotArea plotArea = new FarPoint.Web.Chart.YPlotArea();
    plotArea.Location = new System.Drawing.PointF(0.1f, 0.1f);
    plotArea.Size = new System.Drawing.SizeF(0.83f, 0.77f);
    plotArea.Series.Add(series1);
    plotArea.Series.Add(series2);
    plotArea.XAxis.LabelTextFont = new System.Drawing.Font("メイリオ", 8);
    plotArea.YAxes.Clear();
    plotArea.YAxes.AddRange(new FarPoint.Web.Chart.ValueAxis[] {y1,y2});

    // ラベルの設定
    FarPoint.Web.Chart.LabelArea label = new FarPoint.Web.Chart.LabelArea();
    label.Text = "気温(℃)と降水量(mm)";
    label.Location = new System.Drawing.PointF(0.5f, 0.02f);
    label.AlignmentX = 0.5f;
    label.AlignmentY = 0f;
    label.TextFont = new System.Drawing.Font("メイリオ", 14);

    // モデルへの追加
    FarPoint.Web.Chart.ChartModel model = new FarPoint.Web.Chart.ChartModel();
    model.LabelAreas.Add(label);
    model.PlotAreas.Add(plotArea);
    FpChart1.Model = model;
}
実行すると次のようになります。

チャートコントロールは独立したコントロールとなるため、シートの値を更新しても自動的には値が反映されません。ボタンクリックなどによるポストバックの際に明示的に値を更新する必要があります。チャートコントロールの詳細は製品ヘルプの「チャートコントロールの作成」でも解説しています。
数式エクステンダ
SPREADコントロール内で使用できる豊富な表計算関数は、Excelライクなアプリケーションを作成するためには欠かせない機能ですが、それらの関数をコントロールの外でも使用できるようになりました。
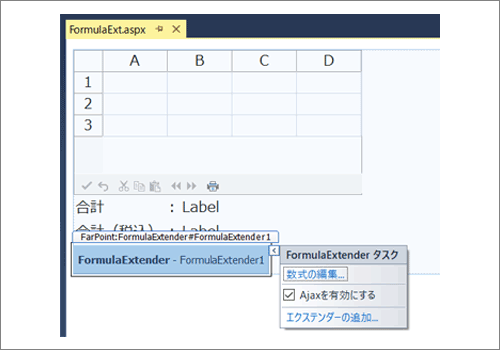
数式エクステンダをWebフォームに配置した後、数式エクステンダのスマートタグにある「数式の編集...」からコレクションエディターを起動させます。

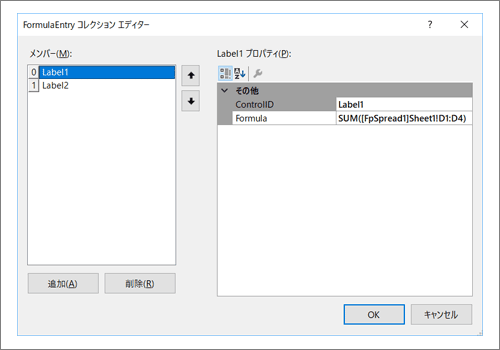
コレクションエディターではページ上にある各コントロールに設定する関数を管理することができます。ここではWebフォーム上に2つのラベルコントロールを配置しており、追加ボタンを押下後にコントロールのID(ControlID)と関数(Formula)をそれぞれ設定しています。デザイン画面で数式を設定すればVBやC#で計算ロジックを書くことなく計算結果を得られるようになります。

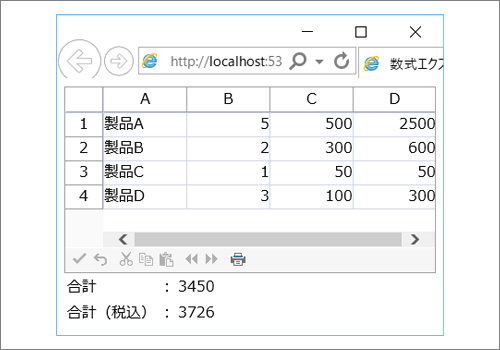
次のサンプルコードではSPREADコントロール内でも数式による計算を行っており、B列とC列を掛けた値をD列に設定しています。
Protected Sub Page_Load(ByVal sender As Object, ByVal e As System.EventArgs) Handles Me.Load
    If IsPostBack Then Return

    ' シートとセル型の設定
    FpSpread1.ActiveSheetView.RowCount = 4
    FpSpread1.ActiveSheetView.Columns(1, 3).CellType = New FarPoint.Web.Spread.IntegerCellType()

    ' シート内の値の設定
    FpSpread1.ActiveSheetView.SetValue(0, 0, "製品A")
    FpSpread1.ActiveSheetView.SetValue(1, 0, "製品B")
    FpSpread1.ActiveSheetView.SetValue(2, 0, "製品C")
    FpSpread1.ActiveSheetView.SetValue(3, 0, "製品D")
    FpSpread1.ActiveSheetView.SetValue(0, 1, 5)
    FpSpread1.ActiveSheetView.SetValue(1, 1, 2)
    FpSpread1.ActiveSheetView.SetValue(2, 1, 1)
    FpSpread1.ActiveSheetView.SetValue(3, 1, 3)
    FpSpread1.ActiveSheetView.SetValue(0, 2, 500)
    FpSpread1.ActiveSheetView.SetValue(1, 2, 300)
    FpSpread1.ActiveSheetView.SetValue(2, 2, 50)
    FpSpread1.ActiveSheetView.SetValue(3, 2, 100)

    ' シート内の関数の設定
    FpSpread1.ActiveSheetView.ReferenceStyle = FarPoint.Web.Spread.Model.ReferenceStyle.R1C1
    FpSpread1.ActiveSheetView.Columns(3).Formula = "RC[-2]*RC[-1]"
End Sub
protected void Page_Load(object sender, EventArgs e)
{
    if (IsPostBack) return;

    // シートとセル型の設定
    FpSpread1.ActiveSheetView.RowCount = 4;
    FpSpread1.ActiveSheetView.Columns[1, 3].CellType = new FarPoint.Web.Spread.IntegerCellType();

    // シート内の値の設定
    FpSpread1.ActiveSheetView.SetValue(0, 0, "製品A");
    FpSpread1.ActiveSheetView.SetValue(1, 0, "製品B");
    FpSpread1.ActiveSheetView.SetValue(2, 0, "製品C");
    FpSpread1.ActiveSheetView.SetValue(3, 0, "製品D");
    FpSpread1.ActiveSheetView.SetValue(0, 1, 5);
    FpSpread1.ActiveSheetView.SetValue(1, 1, 2);
    FpSpread1.ActiveSheetView.SetValue(2, 1, 1);
    FpSpread1.ActiveSheetView.SetValue(3, 1, 3);
    FpSpread1.ActiveSheetView.SetValue(0, 2, 500);
    FpSpread1.ActiveSheetView.SetValue(1, 2, 300);
    FpSpread1.ActiveSheetView.SetValue(2, 2, 50);
    FpSpread1.ActiveSheetView.SetValue(3, 2, 100);

    // シート内の関数の設定
    FpSpread1.ActiveSheetView.ReferenceStyle = FarPoint.Web.Spread.Model.ReferenceStyle.R1C1;
    FpSpread1.ActiveSheetView.Columns[3].Formula = "RC[-2]*RC[-1]";
}

このサンプルコードはあくまでSPREAD内の値と数式の設定のみを行なっており、標準のラベルコントロールの結果はコレクションエディターにある数式により算出されています。数式エクステンダについては製品ヘルプの「数式エクステンダの使用」でも解説されています。


